

Introduction
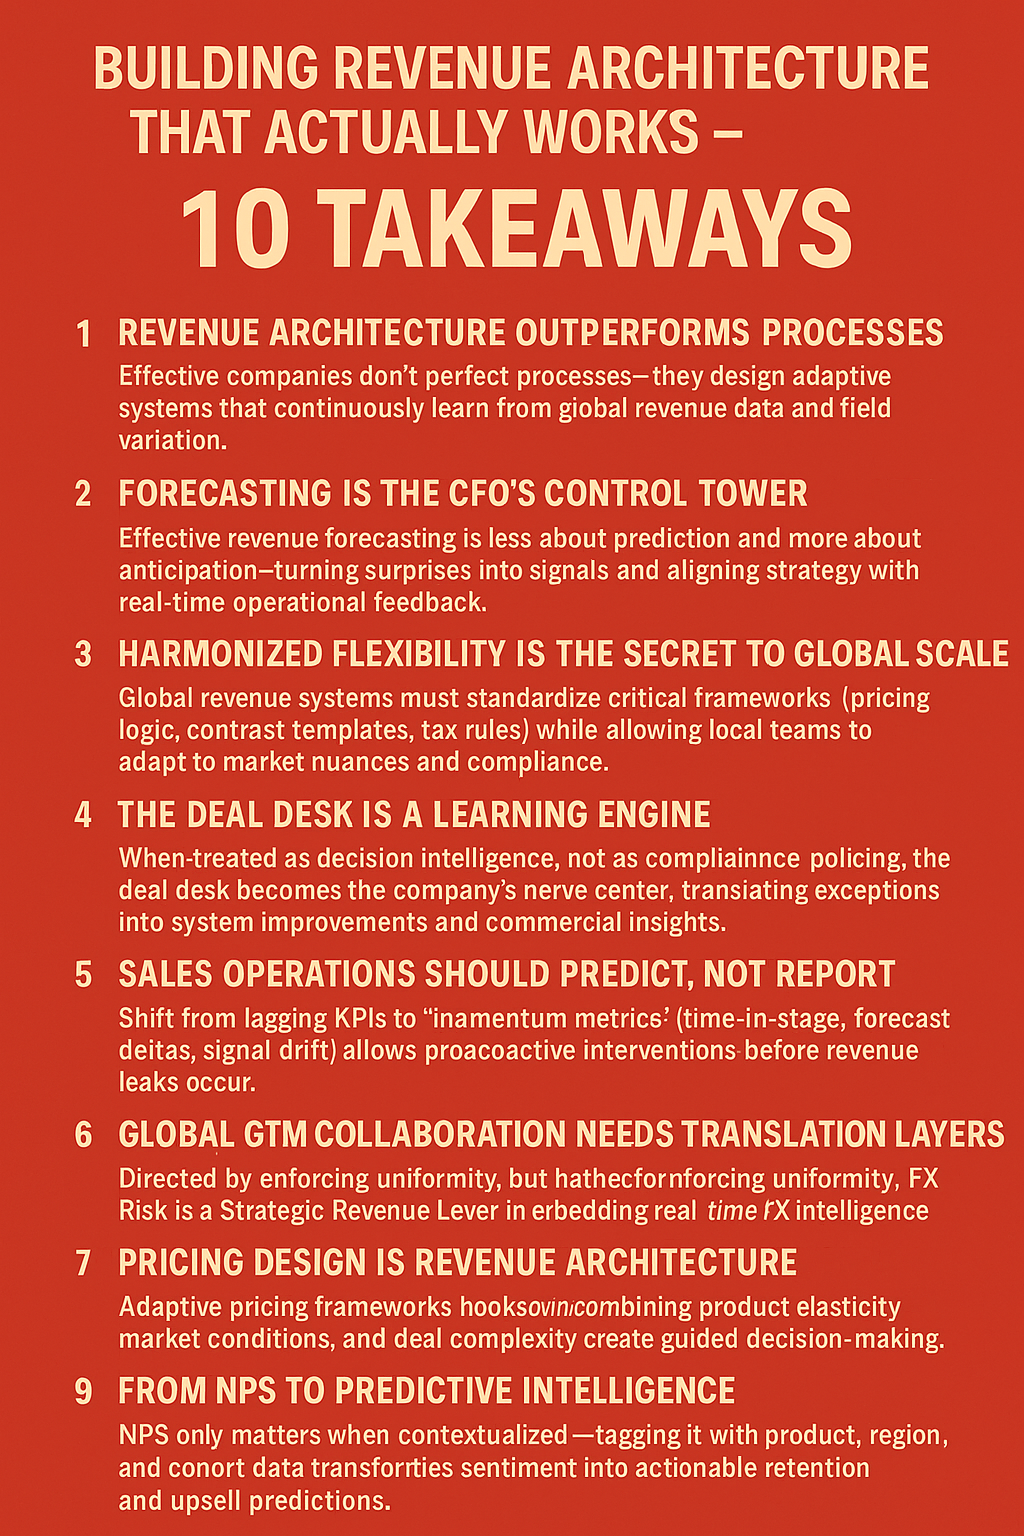
Part One: Building Revenue Architecture That Actually Works
Where It All Started
My journey into revenue operations management began with a simple observation that changed everything. As someone who has worn both CFO and CRO hats across multiple companies, from gaming studios at Atari to hypergrowth environments like Emerge Digital Group, I quickly realized that traditional approaches to global revenue optimization often fall short. Understanding revenue forecasting has become essential because it helps prevent surprises and drive strategic decision-making. Learning to forecast revenue effectively and mastering it across complex operations transformed the way I approached growth, alignment, and resource allocation.
Picture this: you are looking at two seemingly identical deals—same price point, similar company profiles, signed within days of each other. Yet six months later, one becomes your poster child for expansion while the other quietly churns. The difference? It is rarely what you think.
After years of digging into these patterns across my roles at Singularity University, Lifestyle Solutions, and various tech companies, I realized something crucial: revenue operations strategy is not about perfecting processes, but it is about designing systems that learn and adapt.
My background in economics from CSUEB, combined with data analytics training from Georgia Tech, taught me to look for asymmetries rather than averages. When I transitioned from pure finance roles to managing cross-functional revenue alignment across North America, Europe, and Asia, systems thinking became my secret weapon.
The Reality of Global Revenue Operations
Here is what no one tells you about scaling B2B revenue operations across continents: headquarters logic does not survive first contact with local markets. Period.
I learned this the hard way while implementing revenue operations platforms across three continents. American sales teams obsess over quarterly cycles. Japanese enterprise buyers expect formal relationship-building that spans months. Brazilian deals require navigating both federal and municipal tax frameworks before you can even think about revenue cycle management.
The Tenth Takeway: The Feedback Loop Is the Ultimate Competitive Advantage – Systems that measure, tag, and learn from every transaction—redlines, delays, and disputes—evolve faster than competitors. The organization becomes self-correcting and antifragile. ( It does not fit in the infographic despite all my tries. My apologies!)
Rather than forcing uniformity, I developed what I call “harmonized flexibility”. These systems standardize the critical stuff while adapting to local realities. This meant building sales operations management workflows that could handle:
- Localized pricing logic within our CPQ system
- Contract templates that reflected cultural norms, not just legal requirements
- VAT/GST rules embedded directly into billing flows
- FX hedging mechanisms that balanced financial stability with sales agility
The breakthrough came when we created a revenue routing matrix that connected product, geography, and delivery method to the correct tax treatment and entity booking. This was not just about recording revenue, but about making that revenue real, compliant, and repeatable.
But here is the thing that really matters: trust. Every global team I have led taught me that you earn the right to standardize by first proving you understand what makes each region unique. This principle shaped my approach to revenue operations metrics and reporting.
Instead of arguing whether to use net ARR velocity (US preference) or net revenue retention (European focus), I built unified dashboards that presented both perspectives with traceable inputs. We did not force teams to speak a single language. We built translation layers.
Deal Desk as Decision Intelligence
Most companies treat their deal desk like a compliance checkpoint. I reimagined ours as a revenue intelligence platform that actually taught the business how to sell better.
We constructed conditional rules rather than static processes. EU deals over $500K automatically pull GDPR-compliant data privacy addenda. Indian services deals adjusted tax profiles to avoid GST double taxation. These were not edge cases; they were everyday scenarios that our system continuously learned from.
The magic happened when we stopped trying to eliminate exceptions and started making them visible. Every deviation became a learning artifact that fed back into our sales process optimization.
In one quarterly review, we discovered that deals requiring multiple redlines in Latin America showed 40% lower renewal rates in Year Two. That insight led us to revise contract clarity protocols, not just post-sale engagement strategies.
Our Quote-to-Cash process became more than operational efficiency: it became a signal engine. We embedded feedback hooks at each stage: quote generation, legal review, billing setup, and post-sale enablement. Delays were not just fixed; they were tagged, analyzed, and prevented from recurring.
Sales Operations Through a Systems Lens
Traditional sales analytics dashboards focus on lagging indicators. I focused on adaptive design and leading signals rather than on the latter.
Our playbooks did not just outline features and ICP criteria; they also embedded triggers for real-time learning. When reps encountered specific objections during discovery, they flagged potential product-market mismatches and initiated immediate feedback loops to our product team.
We introduced “momentum metrics,” including average time in stage, forecast accuracy deltas, and email responsiveness rates. Sales managers learned to intervene based on measurable signal drift, not gut instinct. This allowed us to detect performance issues before they appeared in booking numbers.
Most importantly, we created mechanisms for knowledge sharing across geographies. A win in France triggered structured syncs with the UK team to review pattern overlaps. Japan shared detailed loss reviews after major enterprise RFPs. These were not postmortems, but they were field experiments that made the entire organization smarter.
GTM Collaboration That Actually Works
Cross-border GTM collaboration typically fails on two assumptions: that headquarters knows best and that field teams just need enablement. Both are wrong.
Global teams often innovate faster because resource constraints force creative solutions. I learned to watch for these innovations and scale them back into our core processes.
Our APAC team developed a lightweight, value-first proposal format that improved time-to-demo by 30%. We rolled that out to US commercial segments within weeks. Meanwhile, European enterprise teams built robust pricing calculators for complex approval structures, and we quickly integrated them into Salesforce globally.
To make this systematic, I instituted structured collaboration rituals:
- Monthly global GTM syncs with rotating region-led presentations
- Shared scorecards that allowed local metric customization
- Rewards for knowledge transfer, not just performance metrics
Marketing-qualified leads and sales-qualified leads became globally aligned personas, with regional customization for tone, references, and buying behaviors. Our playbooks explained not just what to say, but how to listen differently in each market.
This culture shift was profound. US teams stopped assuming they set the standard. Global teams felt heard and valued. The revenue system began behaving less like silos and more like a single, adaptive organism.
Part Two: Intelligence, Pricing, and Feedback Loops
The Hidden Impact of Foreign Exchange
Managing revenue forecasting across six time zones taught me that FX exposure is not a back-office function, but it is a strategic revenue lever that most companies mishandle entirely.
Here is the scenario: your American team prices in USD by default. A South Korean customer wants to pay in KRW with consistent pricing for a multi-year contract. If the dollar strengthens 6% in Year Two, who absorbs the difference? If local teams offer discounts to hedge that risk, how does it impact gross margin metrics at headquarters?
I embedded real-time FX intelligence directly into deal design. Our pricing sheets dynamically adjusted for currency trends, and we built rules into CPQ logic to protect against margin erosion. Each region received guardrails, not hard stops, allowing competitive negotiations without undermining consolidated financial strategy.
We also linked currency risk to compensation models. Closed deals in Yen in Atari no longer received static quota credit, since we weighted attainment by FX-adjusted net revenue. This led to better behaviors, improved forecasting accuracy, and alignment between RevOps and finance in a shared strategic language.
Pricing Strategy as Revenue Architecture
For years, I treated pricing as a commercial lever. Now I treat it as foundational revenue operations automation. Global pricing requires alignment among sales, legal, finance, tax, and marketing, a truth that becomes clear when your first localized contract triggers an invoice misclassification.
My response was architectural. I co-developed a pricing design framework that harmonized product configuration, local economic indicators, competitive benchmarking, and strategic margin goals into an adaptive grid.
Regional leaders could draw from this framework like a policy matrix. When launching bundled offerings in Southeast Asia, we used region-specific elasticity coefficients to define price anchors and discount thresholds. Finance approved it once. Sales used it dozens of times. Deal desk validated it in real-time.
The secret was not in the math, but it was in the system. We removed friction by embedding policy into infrastructure. Discounts became guided decisions rather than escalations. By tracking usage patterns, we refined the parameters each quarter. The system did not just reflect strategy, but it evolved it.
This approach proved especially powerful with partner pricing. We structured a two-tier margin-sharing framework that responded dynamically to deal size, geography, and delivery complexity. Partners felt empowered, internal teams felt protected, and we avoided channel cannibalization.
From NPS to Predictive Intelligence
NPS scores float in executive summaries like friendly ghosts. These are respected but misunderstood. What I realized across markets is that NPS offers little insight unless paired with context and cross-functional data.
A score of 6 in Germany does not mean the same thing as a 6 in Australia. A shift from 7 to 8 in Japan might signal a dramatic improvement in sentiment that does not move the overall needle.
So I stopped asking “What is our NPS?” and started asking “What does it predict?”
We rebuilt surveys with a structured taxonomy: capturing numeric scores plus thematic metadata tagged by product module, region, onboarding cohort, and customer lifetime value segment. Then we fed that data into our revenue retention model.
The correlations were eye-opening:
- North American detractors were 2.7x more likely to churn than promoters
- Latin American correlation dropped to 1.4x, but detractor status significantly delayed upsell timelines
- European passives proved riskier than detractors because detractors engaged with support, while passives drifted quietly
These patterns became the foundation of our Customer Health Index, which drove account management prioritization. Sales did not just renew, but they preempted risk. Customer Success did not just react, but they intervened with precision.
Building Compliance Into Flow
Global operations introduce complexity that cannot be wished away. Local tax codes, contracting laws, and invoice formats each demand precision. Most companies address this with control mechanisms that slow revenue down.
My approach was different: build compliance into the flow, not on top of it.
I deployed real-time rule engines in our deal desk and CPQ platforms. We defined compliance checkpoints: VAT treatment, PO requirements, and contract signatures by jurisdiction. The system did not require reps to remember rules; it surfaced requirements contextually.
India made GST fields mandatory. French deals over €250K switched to locally-approved legal terms. The system eliminated ambiguity without creating friction.
This pattern extended to reporting. Our global revenue reporting automation allowed entity-level views aligned with statutory formats, while consolidated views reflected management accounting. We did not force a single structure, but we respected multiple truths, helping us pass audits while running faster.
The Feedback Loop as Competitive Advantage
In complex systems, adaptation beats prediction every time. This insight, borrowed from my fascination with information theory during my data analytics studies at Georgia Tech, shaped my entire RevOps implementation philosophy.
I do not ask “Is our process optimal?” I ask, “Is our system learning?”
That distinction transformed how we designed everything. We embedded telemetry into contract cycles —not just timestamps —but also reason codes for redlines, pricing escalations, and legal substitutions. Correlating these patterns with close rates, cycle time, and future churn revealed crucial insights.
Deals that redlined three or more times had 40% higher churn risk within 12 months and closed 18% slower on average. We used that data to redesign templates and training. Legal simplified fallback clauses. Sales learned to pre-frame risk points earlier in cycles.
We applied this learning philosophy everywhere:
- Onboarding processes had parallel signal loops
- Billing systems tracked dispute reasons and fed them back to the quoting logic
- CSAT scores triggered product feedback that shaped roadmaps
- Each node informed every other node
Over time, the organization developed a rhythm of reflection and adjustment that became embedded in how we operated. This is where operational maturity meets resilience.
From Fragmentation to Flow
Looking back, the challenge of global revenue optimization has never been about scale; it has been about cohesion. Multiple geographies, systems, and regulatory frameworks naturally accelerate entropy—communication fragments. Process drifts. Intent gets diluted.
Yet I have learned that coherence is possible through structure, not control. Not by eliminating variance, but by designing for it.
Throughout my career, from managing gaming studios in the Bay Area and France to overseeing hypergrowth at Emerge Digital Group, I have seen organizations thrive when systems are designed to listen, learn, and adapt.
That has been my work: harmonizing pricing structures across jurisdictions, embedding tax compliance into QTC workflows, designing deal desks that protect margin while empowering field teams, and transforming NPS from fuzzy metrics to sharp predictive tools.
Through it all, I have held one principle: complexity is not the enemy of revenue, but rather it is the most honest teacher. The systems that learn from complexity intelligently, incrementally, and globally do not just grow. They endure.
Revenue operations strategy is not about perfect processes. It is about building organizations that get smarter with every transaction, every interaction, every exception. In our hyperconnected global economy, that capability is not just a competitive advantage, but it is survival.
Hindol Datta has served as CFO and CRO across multiple high-growth companies, from gaming (Atari) to edtech (Singularity University) to hypergrowth environments (Adteractive, EDG). He combines economics training from California State University with data analytics expertise from Georgia Tech to help organizations build revenue systems that scale globally while adapting locally.